Mynd:VI phase.svg
Útlit

Stærð þessarar PNG forskoðunar á SVG skránni: 700 × 600 mynddílar. Aðrar upplausnir: 280 × 240 mynddílar | 560 × 480 mynddílar | 896 × 768 mynddílar | 1.195 × 1.024 mynddílar | 2.389 × 2.048 mynddílar.
Upphafleg skrá (SVG-skrá, að nafni til 700 × 600 mynddílar, skráarstærð: 76 KB)
Breytingaskrá skjals
Smelltu á dagsetningu eða tímasetningu til að sjá hvernig hún leit þá út.
| Dagsetning/Tími | Smámynd | Víddir | Notandi | Athugasemd | |
|---|---|---|---|---|---|
| núverandi | 18. mars 2021 kl. 13:21 |  | 700 × 600 (76 KB) | Nyq | converted text from paths to true editable text, decapitalized common nouns |
| 24. maí 2020 kl. 15:19 |  | 700 × 600 (70 KB) | Andel | cleaner code | |
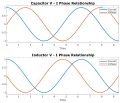
| 24. maí 2020 kl. 14:34 |  | 700 × 600 (177 KB) | Andel | == {{int:filedesc}} == {{Information |description=|Description={{en|Illustration of the voltage-current phase relationships for a capacitor and an inductor.}} |date= 2020-05-24 |source={{own}} |author=Andel |permission= {{PD-chart}}{{self|cc-zero}} |other versions= File:VI phase.png |other fields={{Igen|MATLAB|0|+|code= x = linspace(0,3*pi,1000000); y1 = sin(x+0.5*pi) y2 = sin(x) y3 = -sin(x) tiledlayout(2,1) ax1 = nexttile; plot(ax1,x,y1,x,y2,'LineWidth',2) xlim([0 3*pi])... |
Skráartenglar
Eftirfarandi síða notar þessa skrá:
Altæk notkun skráar
Eftirfarandi wikar nota einnig þessa skrá:
- Notkun á ar.wikipedia.org
- Notkun á en.wikipedia.org
- Notkun á eu.wikipedia.org
- Notkun á fa.wikipedia.org
- Notkun á ja.wikipedia.org
- Notkun á ko.wikipedia.org
- Notkun á lt.wikipedia.org
- Notkun á mk.wikipedia.org
- Notkun á no.wikipedia.org
- Notkun á simple.wikipedia.org
- Notkun á ta.wikipedia.org
- Notkun á tr.wikipedia.org
- Notkun á vi.wikipedia.org
- Notkun á zh.wikipedia.org
