
Mynd:Antarctic Temperature Trend 1981-2007.jpg
Það er engin hærri upplausn til.
Antarctic_Temperature_Trend_1981-2007.jpg (540 × 508 mynddílar, skráarstærð: 93 KB, MIME-gerð: image/jpeg)
Lýsing
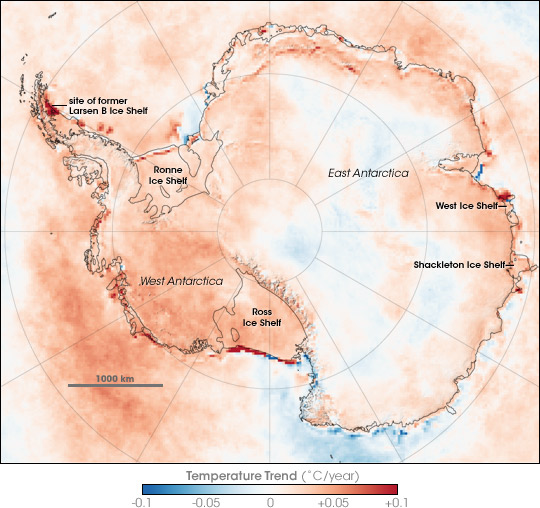
| Lýsing | Map showing Antarctic Skin Temperature Trends between 1981 and 2007. Skin temperature is roughly the top one millimeter of land, sea, snow, or ice. Across most of the Antarctic the temperature increased, in some areas warming approaching 2 degrees Celsius during the period. The map is based on thermal infrared (heat) observations made by a series of NOAA satellite sensors. None of the sensors were in orbit at the same time, so scientists could not compare simultaneous observations from different sensors to make sure each was recording temperatures exactly the same. Instead, the team checked the satellite records against ground-based weather station data to inter-calibrate them and make the 26-year satellite record. The level of uncertainty is between 2 and 3 degrees Celsius. The most dramatic changes are the red areas associated with iceberg calving and the collapse of the Larsen B ice shelf. In these cases, the satellites saw a change from cold ice to relatively warm open water. |
| Dagsetning | |
| Uppruni | en:Internet Archive - https://web.archive.org/web/20070823123915/http://earthobservatory.nasa.gov/Newsroom/NewImages/images.php3?img_id=17838 (originally http://earthobservatory.nasa.gov/Newsroom/NewImages/images.php3?img_id=17838 NASA Earth Observatory) |
| Höfundarréttarhafi | Robert Simmon |
| Aðrar útgáfur | العربيَّة |
Leyfisupplýsingar:
| This file is in the public domain in the United States because it was solely created by NASA. NASA copyright policy states that "NASA material is not protected by copyright unless noted". (See Template:PD-USGov, NASA copyright policy page or JPL Image Use Policy.) | ||
 |
Warnings:
|
Breytingaskrá skjals
Smelltu á dagsetningu eða tímasetningu til að sjá hvernig hún leit þá út.
| Dagsetning/Tími | Smámynd | Víddir | Notandi | Athugasemd | |
|---|---|---|---|---|---|
| núverandi | 21. nóvember 2007 kl. 22:13 | | 540 × 508 (93 KB) | Sagredo | {{Information |Description=Map showing Antarctic Skin Surface Temperature Trends 1981-2007. Skin temperature is roughly the top one millimeter of land, sea, snow, or ice. Across most of the Antarctic the temperature increased, in some areas approachi |
Skráartenglar
Það eru engar síður sem nota þessa skrá.
Altæk notkun skráar
Eftirfarandi wikar nota einnig þessa skrá:
- Notkun á ar.wikipedia.org
- Notkun á ast.wikipedia.org
- Notkun á ca.wikipedia.org
- Notkun á el.wikipedia.org
- Notkun á en.wikipedia.org
- Notkun á eo.wikipedia.org
- Notkun á es.wikipedia.org
- Notkun á gl.wikipedia.org
- Notkun á ja.wikipedia.org
- Notkun á mk.wikipedia.org
- Notkun á nl.wikipedia.org
- Notkun á nn.wikipedia.org
- Notkun á pa.wikipedia.org
- Notkun á pl.wikipedia.org
- Notkun á ur.wikipedia.org
- Notkun á vi.wikipedia.org
- Notkun á zh.wikipedia.org