
Mynd:20211109 Frequency of extreme weather for different degrees of global warming - bar chart IPCC AR6 WG1 SPM.svg

Stærð þessarar PNG forskoðunar á SVG skránni: 800 × 450 mynddílar. Aðrar upplausnir: 320 × 180 mynddílar | 640 × 360 mynddílar | 1.024 × 576 mynddílar | 1.280 × 720 mynddílar | 2.560 × 1.440 mynddílar | 1.200 × 675 mynddílar.
Upphafleg skrá (SVG-skrá, að nafni til 1.200 × 675 mynddílar, skráarstærð: 5 KB)
Lýsing
| Lýsing |
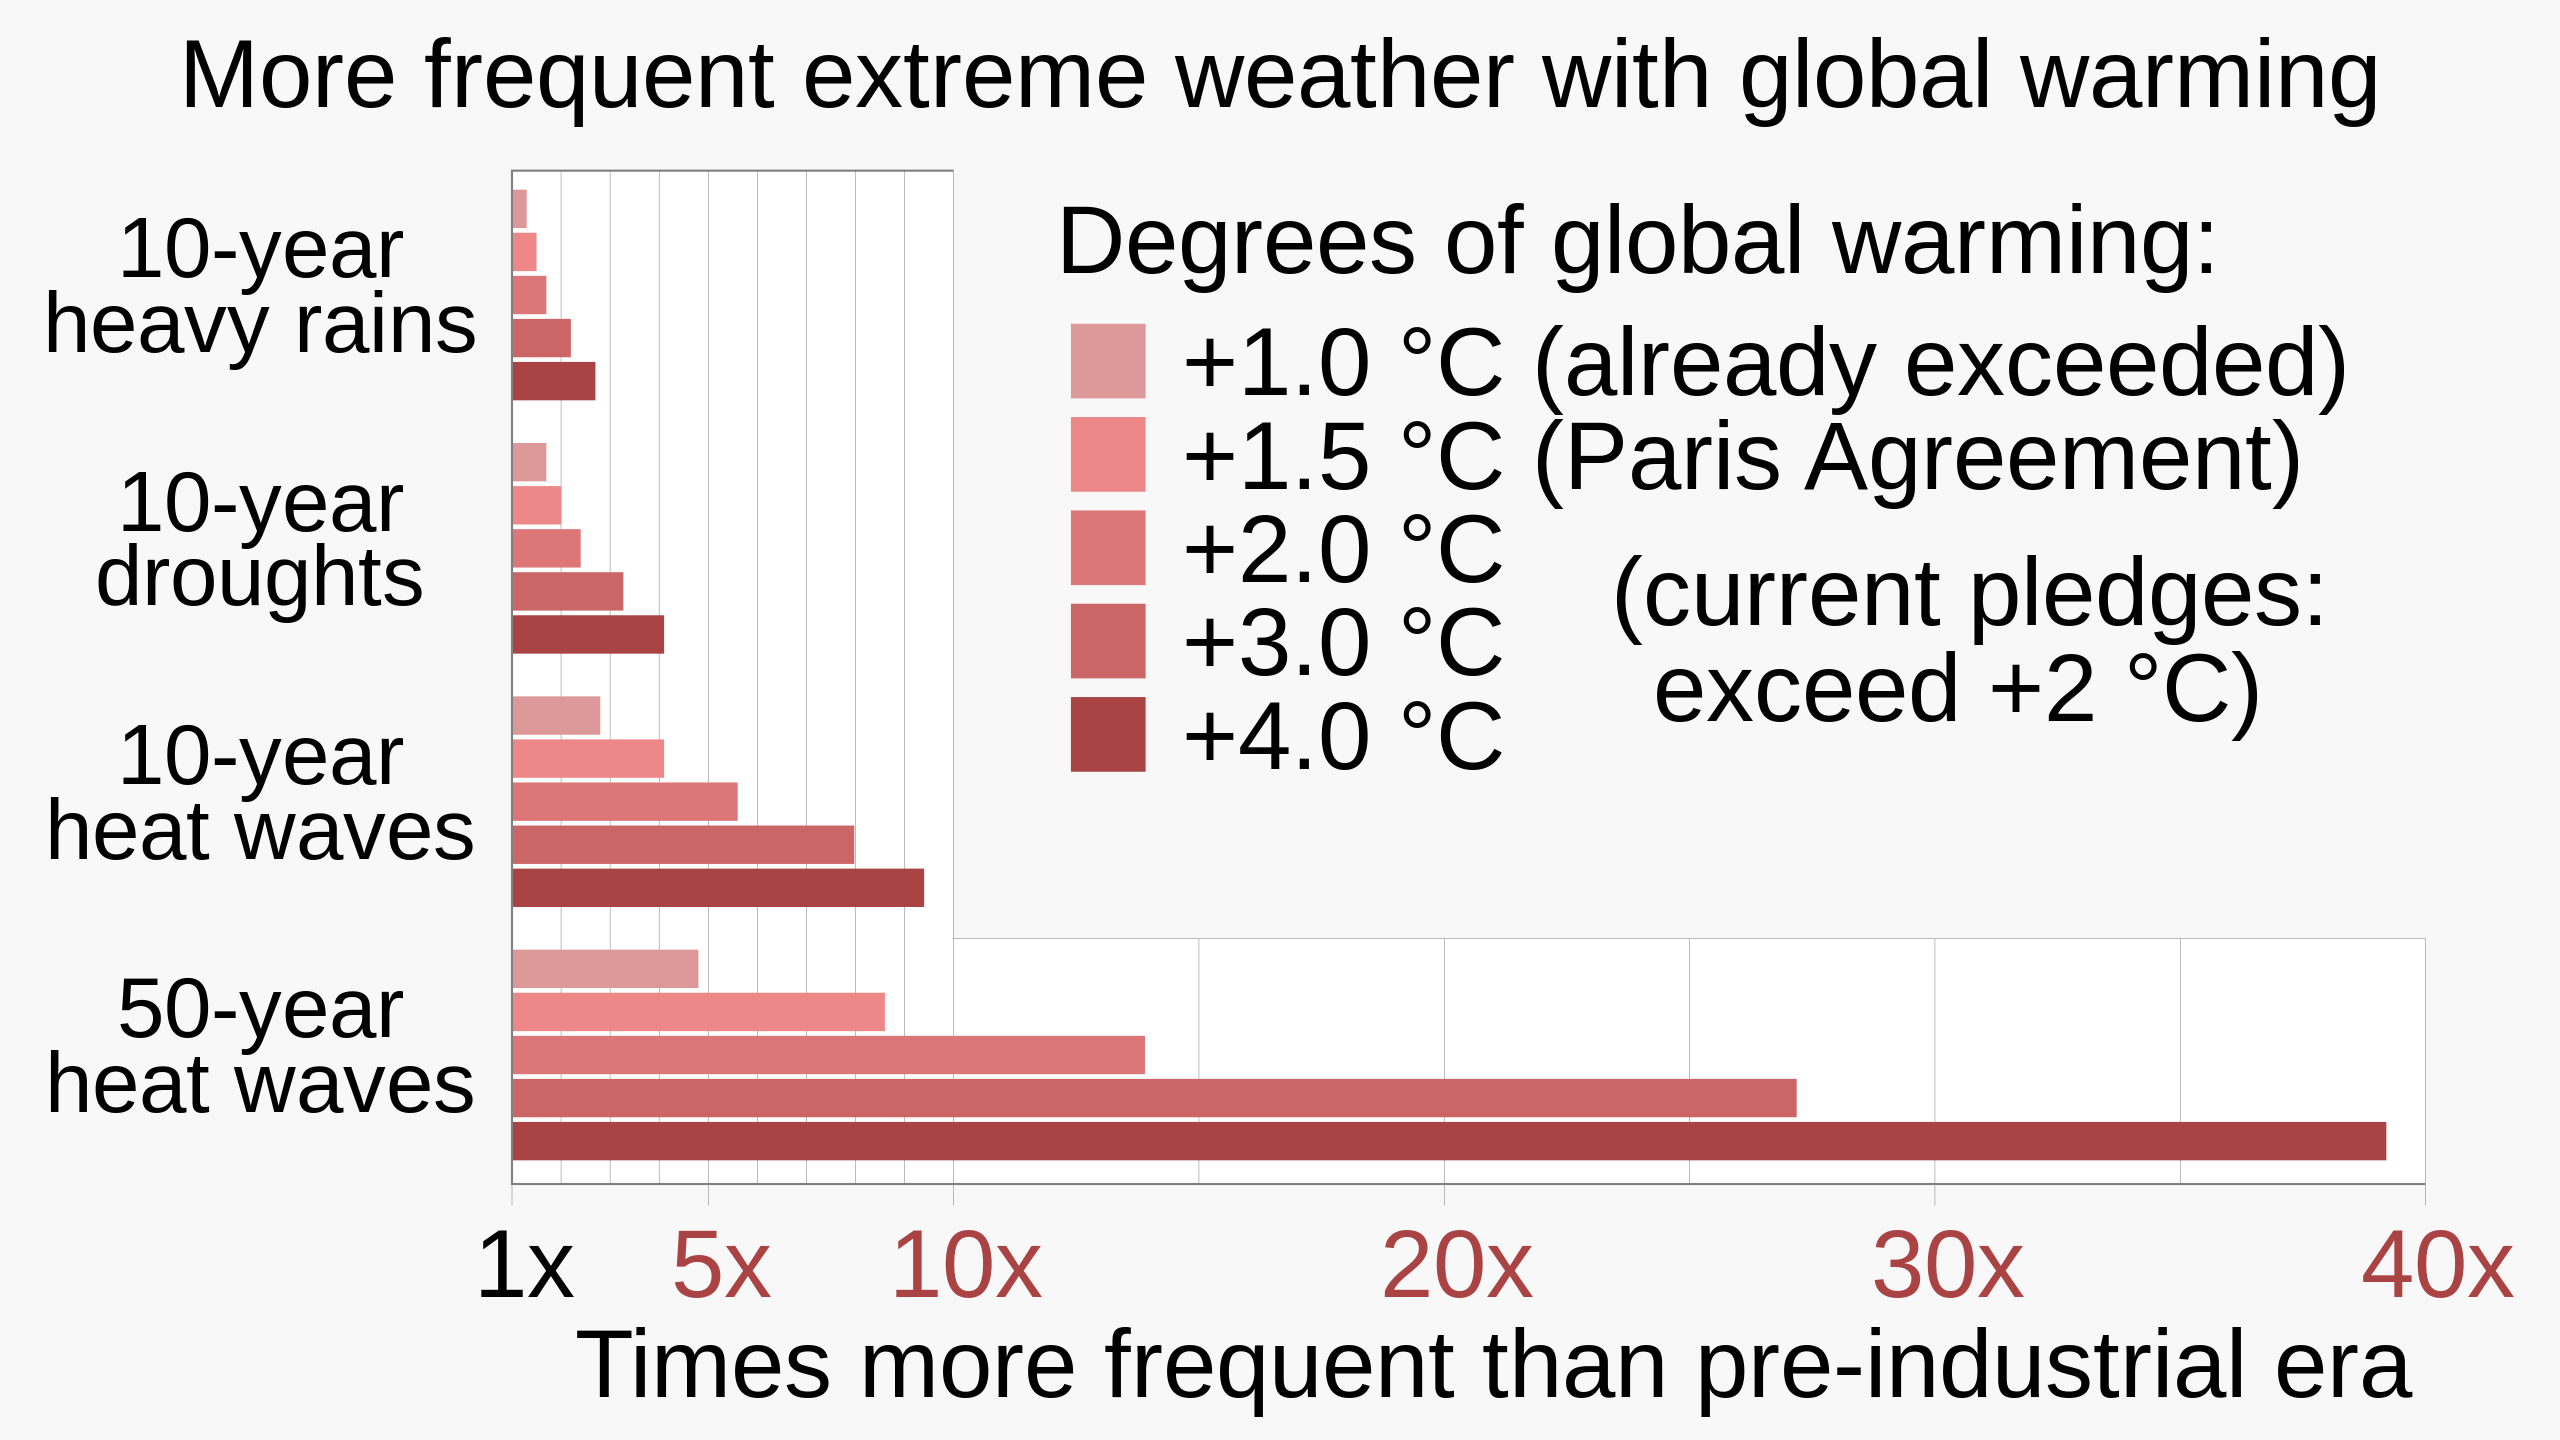
English: Bar chart showing frequency of extreme weather for different degrees of global warming, based on data from IPCC AR6 WG1 SPM (Summary for Policy Makers).
|
||||
| Dagsetning | |||||
| Uppruni | eigin skrá | ||||
| Höfundarréttarhafi | RCraig09 | ||||
| Aðrar útgáfur |
|


Related files
The following files are based on Fig. SPM.6 of the Sixth Assessment Report of the Intergovernmental Panel on Climate Change / Summary for Policymakers:
-
 20210809 Projected extremes for different degrees of global warming - IPCC AR6 WG1 SPM.svg
9 August 2021: Line chart of 10- and 50-year datasets (includes frequency, omits intensity) -
 20211107 Projected extremes for different degrees of global warming - 3x10yr area chart - IPCC AR6 WG1 SPM.svg
7 Nov 2021: "L" charts includes both frequency and intensity of the 10-year datasets (omits 50-year dataset) -
 20211109 Frequency of extreme weather for different degrees of global warming - bar chart IPCC AR6 WG1 SPM.svg
9 Nov 2021: Bar chart of 10- and 50-year datasets (includes frequency, omits intensity) -
 20220208 Projected temperature extremes for different degrees of global warming - orthogonal bar chart - IPCC AR6 WG1 SPM.svg
Orthogonal bar chart of 10-year heat waves (only)


Leyfisupplýsingar:
I, the copyright holder of this work, hereby publish it under the following license:
This file is licensed under the Creative Commons Attribution-Share Alike 4.0 International license.
- Þér er frjálst:
- að deila – að afrita, deila og yfirfæra verkið
- að blanda – að breyta verkinu
- Undir eftirfarandi skilmálum:
- tilvísun höfundarréttar – Þú verður að tilgreina viðurkenningu á höfundarréttindum, gefa upp tengil á notkunarleyfið og gefa til kynna ef breytingar hafa verið gerðar. Þú getur gert þetta á einhvern ásættanlegan máta, en ekki á nokkurn þann hátt sem bendi til þess að leyfisveitandinn styðji þig eða notkun þína á verkinu.
- Deila eins – Ef þú breytir, yfirfærir eða byggir á þessu efni, þá mátt þú eingöngu dreifa því verki með sama eða svipuðu leyfi og upprunalega verkið er með.
Breytingaskrá skjals
Smelltu á dagsetningu eða tímasetningu til að sjá hvernig hún leit þá út.
| Dagsetning/Tími | Smámynd | Víddir | Notandi | Athugasemd | |
|---|---|---|---|---|---|
| núverandi | 29. júlí 2023 kl. 20:44 | | 1.200 × 675 (5 KB) | RCraig09 | Version 12: remove <tspan> declarations embedded within <text> in the title "More frequent...", to work around ongoing text rendering problems on Wikimedia |
| 29. júlí 2023 kl. 20:29 |  | 1.200 × 675 (5 KB) | RCraig09 | Version 11: manually changing "+1.1 °C today" to "(already exceeded)" (in the English language portion) to future-proof this graphic . . . . retained JP translation <switch> elements without change | |
| 6. september 2022 kl. 04:57 |  | 1.200 × 675 (5 KB) | Icosohedral | File uploaded using svgtranslate tool (https://svgtranslate.toolforge.org/). Added translation for zh. | |
| 21. desember 2021 kl. 17:19 |  | 1.200 × 675 (3 KB) | RCraig09 | Version 9: misc changes per suggestions on this file's Talk page. | |
| 22. nóvember 2021 kl. 05:31 |  | 1.200 × 675 (3 KB) | RCraig09 | Version 8: more exact 3.0 C values . . . colors of horizontal axis tick labels | |
| 18. nóvember 2021 kl. 03:40 |  | 1.200 × 675 (3 KB) | RCraig09 | Version 7: adding to legend, 2.7 C under current pledges, per discussions at en.wp's Talk:Climate change | |
| 17. nóvember 2021 kl. 04:58 |  | 1.200 × 675 (4 KB) | RCraig09 | Version 6: Enlarge some font sizes . . . . change some text | |
| 16. nóvember 2021 kl. 06:07 |  | 1.200 × 675 (4 KB) | RCraig09 | Version 5: Used Liberation Sans . . . changed legend to "Present-day =+1.1 C" | |
| 13. nóvember 2021 kl. 18:25 |  | 1.200 × 675 (4 KB) | RCraig09 | Version 4: includes thinner, white vertical gridlines that overlay the colored bars, to make it easier to determine extent of the bars. Darker, wider gridlines remain behind the gridlines so they're visible over the white background. | |
| 13. nóvember 2021 kl. 04:21 |  | 1.200 × 675 (4 KB) | RCraig09 | Version 3: reduced length of some vertical grid lines; removed most of the plot-area outline. |
Skráartenglar
Það eru engar síður sem nota þessa skrá.
Altæk notkun skráar
Eftirfarandi wikar nota einnig þessa skrá:
- Notkun á bn.wikipedia.org
- Notkun á de.wikipedia.org
- Notkun á en.wikipedia.org
- Notkun á eo.wikipedia.org
- Notkun á ko.wikipedia.org
- Notkun á ms.wikipedia.org
- Notkun á pt.wikipedia.org
- Notkun á ru.wikipedia.org
- Notkun á rw.wikipedia.org
- Notkun á tr.wikipedia.org
- Notkun á zh.wikipedia.org