
Mynd:1951+ Percent of global area at temperature records - Seasonal comparison - NOAA.svg

Stærð þessarar PNG forskoðunar á SVG skránni: 800 × 560 mynddílar. Aðrar upplausnir: 320 × 224 mynddílar | 640 × 448 mynddílar | 1.024 × 717 mynddílar | 1.280 × 896 mynddílar | 2.560 × 1.792 mynddílar | 2.000 × 1.400 mynddílar.
Upphafleg skrá (SVG-skrá, að nafni til 2.000 × 1.400 mynddílar, skráarstærð: 23 KB)
Lýsing
| Lýsing |
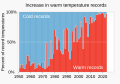
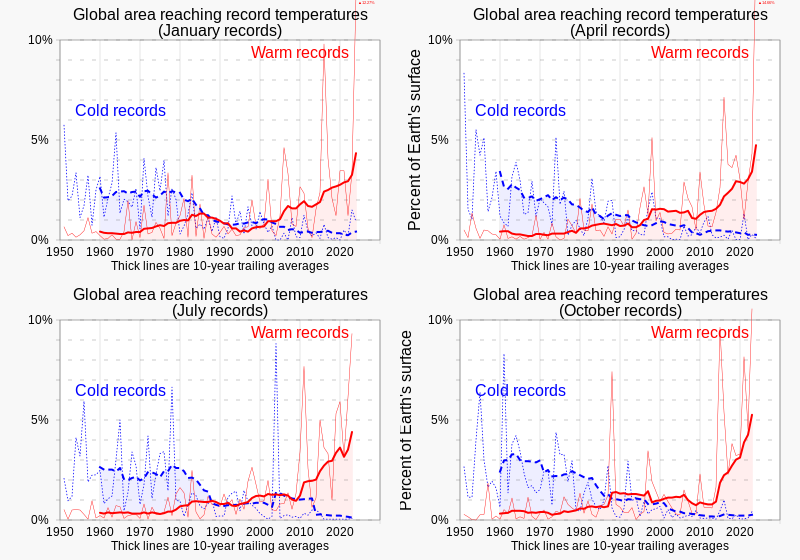
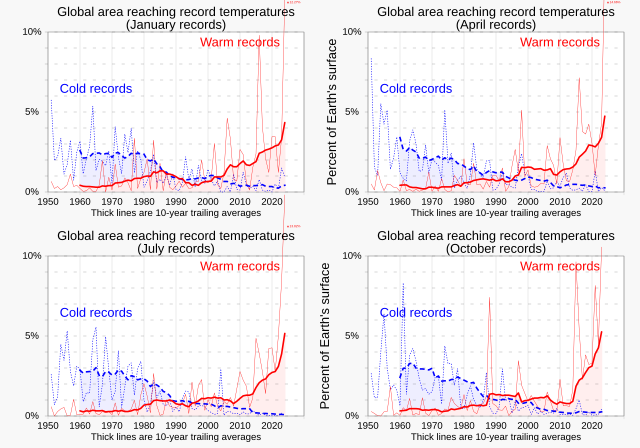
English: Charts comparing percentages of Earth's surface reaching record temperatures since 1951, comparing records for January, April, July and October, from NOAA data.
|
||
| Dagsetning | |||
| Uppruni | eigin skrá | ||
| Höfundarréttarhafi | RCraig09 |

Related files
-
 01 January - Percent of global area at temperature records - Global warming - NOAA.svg
(January data) -
 02 February - Percent of global area at temperature records - Global warming - NOAA.svg
(February data) -
 03 March - Percent of global area at temperature records - Global warming - NOAA.svg
(March data) -
 04 April - Percent of global area at temperature records - Global warming - NOAA.svg
(April data) -
 05 May - Percent of global area at temperature records - Global warming - NOAA.svg
(May data) -
 06 June - Percent of global area at temperature records - Global warming - NOAA.svg
(June data)


-
 07 July - Percent of global area at temperature records - Global warming - NOAA.svg
(July data) -
 08 August - Percent of global area at temperature records - Global warming - NOAA.svg
(August data) -
 09 September - Percent of global area at temperature records - Global warming - NOAA.svg
(September data) -
 10 October - Percent of global area at temperature records - Global warming - NOAA.svg
(October data) -
 11 November - Percent of global area at temperature records - Global warming - NOAA.svg
(November data) -
 12 December - Percent of global area at temperature records - Global warming - NOAA.svg
(December data)


-
 1951+ Percent of global area at temperature records - Seasonal comparison - NOAA.svg
Seasonal comparison -
 1951 - Percent of global area at temperature records (monthly) - Global warming - NOAA.svg
All months scatterplot/dot plot -
 1951- RATIO of new record warm temperatures to new record cold temperatures (monthly) - Global warming.svg
Ratios scatterplot/dot plot (monthly) -
 1951- Percent of record temperatures that are cold or warm records.svg
 -
 1951- Warm and cold record temperatures - bar chart.svg

_-_Global_warming_-_NOAA.svg)
_-_Global_warming.svg)


Leyfisupplýsingar:
I, the copyright holder of this work, hereby publish it under the following license:
This file is licensed under the Creative Commons Attribution-Share Alike 4.0 International license.
- Þér er frjálst:
- að deila – að afrita, deila og yfirfæra verkið
- að blanda – að breyta verkinu
- Undir eftirfarandi skilmálum:
- tilvísun höfundarréttar – Þú verður að tilgreina viðurkenningu á höfundarréttindum, gefa upp tengil á notkunarleyfið og gefa til kynna ef breytingar hafa verið gerðar. Þú getur gert þetta á einhvern ásættanlegan máta, en ekki á nokkurn þann hátt sem bendi til þess að leyfisveitandinn styðji þig eða notkun þína á verkinu.
- Deila eins – Ef þú breytir, yfirfærir eða byggir á þessu efni, þá mátt þú eingöngu dreifa því verki með sama eða svipuðu leyfi og upprunalega verkið er með.
Breytingaskrá skjals
Smelltu á dagsetningu eða tímasetningu til að sjá hvernig hún leit þá út.
| Dagsetning/Tími | Smámynd | Víddir | Notandi | Athugasemd | |
|---|---|---|---|---|---|
| núverandi | 24. febrúar 2024 kl. 00:23 | | 2.000 × 1.400 (23 KB) | RCraig09 | Version 7: Update to include chart showing data for January 2024 |
| 16. nóvember 2023 kl. 05:38 |  | 2.000 × 1.400 (24 KB) | RCraig09 | Version 6: remove minor extraneous characters from October quadrant | |
| 16. nóvember 2023 kl. 05:34 |  | 2.000 × 1.400 (24 KB) | RCraig09 | Version 5: Update with October 2023 chart | |
| 15. ágúst 2023 kl. 03:57 |  | 2.000 × 1.400 (26 KB) | RCraig09 | Version 4: update to include July chart through 2023 | |
| 30. júlí 2023 kl. 21:08 |  | 2.000 × 1.400 (27 KB) | RCraig09 | Version 3: Add April and October graphics, for four-season comparison | |
| 29. júlí 2023 kl. 04:00 | 2.000 × 700 (13 KB) | RCraig09 | Version 2: re-centering some text strings | ||
| 28. júlí 2023 kl. 22:37 | 2.000 × 700 (13 KB) | RCraig09 | Uploaded own work with UploadWizard |
Skráartenglar
Það eru engar síður sem nota þessa skrá.
Altæk notkun skráar
Eftirfarandi wikar nota einnig þessa skrá:
- Notkun á bn.wikipedia.org
- Notkun á cs.wikipedia.org
- Notkun á en.wikipedia.org
- Notkun á ha.wikipedia.org
- Notkun á id.wikipedia.org
- Notkun á mk.wikipedia.org
- Notkun á zh.wikipedia.org