
Mynd:1880- Global average sea level rise (SLR) - annually.svg

Stærð þessarar PNG forskoðunar á SVG skránni: 800 × 450 mynddílar. Aðrar upplausnir: 320 × 180 mynddílar | 640 × 360 mynddílar | 1.024 × 576 mynddílar | 1.280 × 720 mynddílar | 2.560 × 1.440 mynddílar | 1.200 × 675 mynddílar.
Upphafleg skrá (SVG-skrá, að nafni til 1.200 × 675 mynddílar, skráarstærð: 6 KB)
Lýsing
| Lýsing |
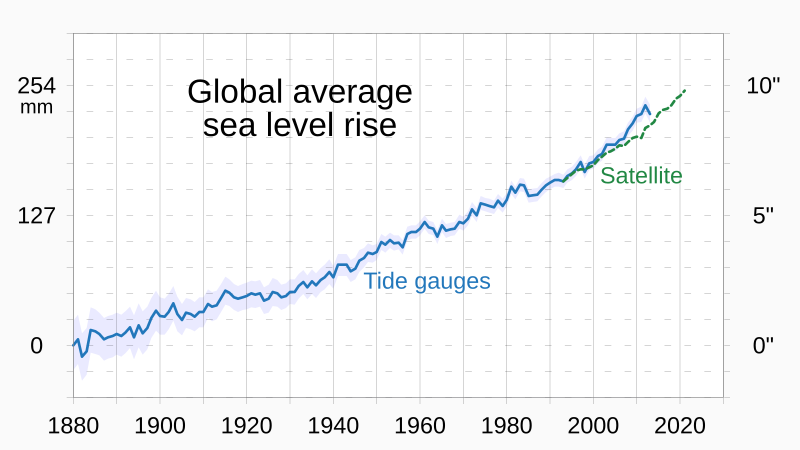
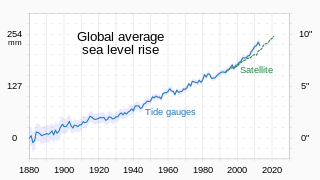
English: Chart showing global average sea level rise (SLR), annually
|
||
| Dagsetning | |||
| Uppruni | eigin skrá | ||
| Höfundarréttarhafi | RCraig09 |
_-_annually.svg)
_-_annually.svg)
_-_annually.svg)
Leyfisupplýsingar:
I, the copyright holder of this work, hereby publish it under the following license:
This file is licensed under the Creative Commons Attribution-Share Alike 4.0 International license.
- Þér er frjálst:
- að deila – að afrita, deila og yfirfæra verkið
- að blanda – að breyta verkinu
- Undir eftirfarandi skilmálum:
- tilvísun höfundarréttar – Þú verður að tilgreina viðurkenningu á höfundarréttindum, gefa upp tengil á notkunarleyfið og gefa til kynna ef breytingar hafa verið gerðar. Þú getur gert þetta á einhvern ásættanlegan máta, en ekki á nokkurn þann hátt sem bendi til þess að leyfisveitandinn styðji þig eða notkun þína á verkinu.
- Deila eins – Ef þú breytir, yfirfærir eða byggir á þessu efni, þá mátt þú eingöngu dreifa því verki með sama eða svipuðu leyfi og upprunalega verkið er með.
Breytingaskrá skjals
Smelltu á dagsetningu eða tímasetningu til að sjá hvernig hún leit þá út.
| Dagsetning/Tími | Smámynd | Víddir | Notandi | Athugasemd | |
|---|---|---|---|---|---|
| núverandi | 28. október 2023 kl. 17:13 | | 1.200 × 675 (6 KB) | RCraig09 | Version 2: place international units on left axis, per suggestion on Talk Page |
| 26. október 2023 kl. 05:53 |  | 1.200 × 675 (6 KB) | RCraig09 | Uploaded own work with UploadWizard |
Skráartenglar
Það eru engar síður sem nota þessa skrá.
Altæk notkun skráar
Eftirfarandi wikar nota einnig þessa skrá:
- Notkun á bn.wikipedia.org
- Notkun á cs.wikipedia.org
- Notkun á en.wikipedia.org
- Notkun á ko.wikipedia.org
_-_annually.svg)