
Mynd:Physical Drivers of climate change.svg

Upphafleg skrá (SVG-skrá, að nafni til 960 × 893 mynddílar, skráarstærð: 33 KB)
This file is translated using SVG <switch> elements. All translations are stored in the same file! Learn more.
For most Wikipedia projects, you can embed the file normally (without a To translate the text into your language, you can use the SVG Translate tool. Alternatively, you can download the file to your computer, add your translations using whatever software you're familiar with, and re-upload it with the same name. You will find help in Graphics Lab if you're not sure how to do this. |
Lýsing
| Lýsing |
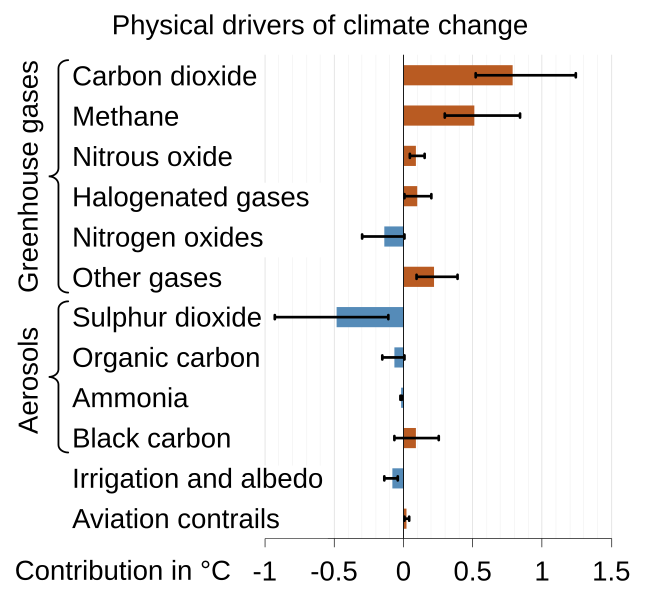
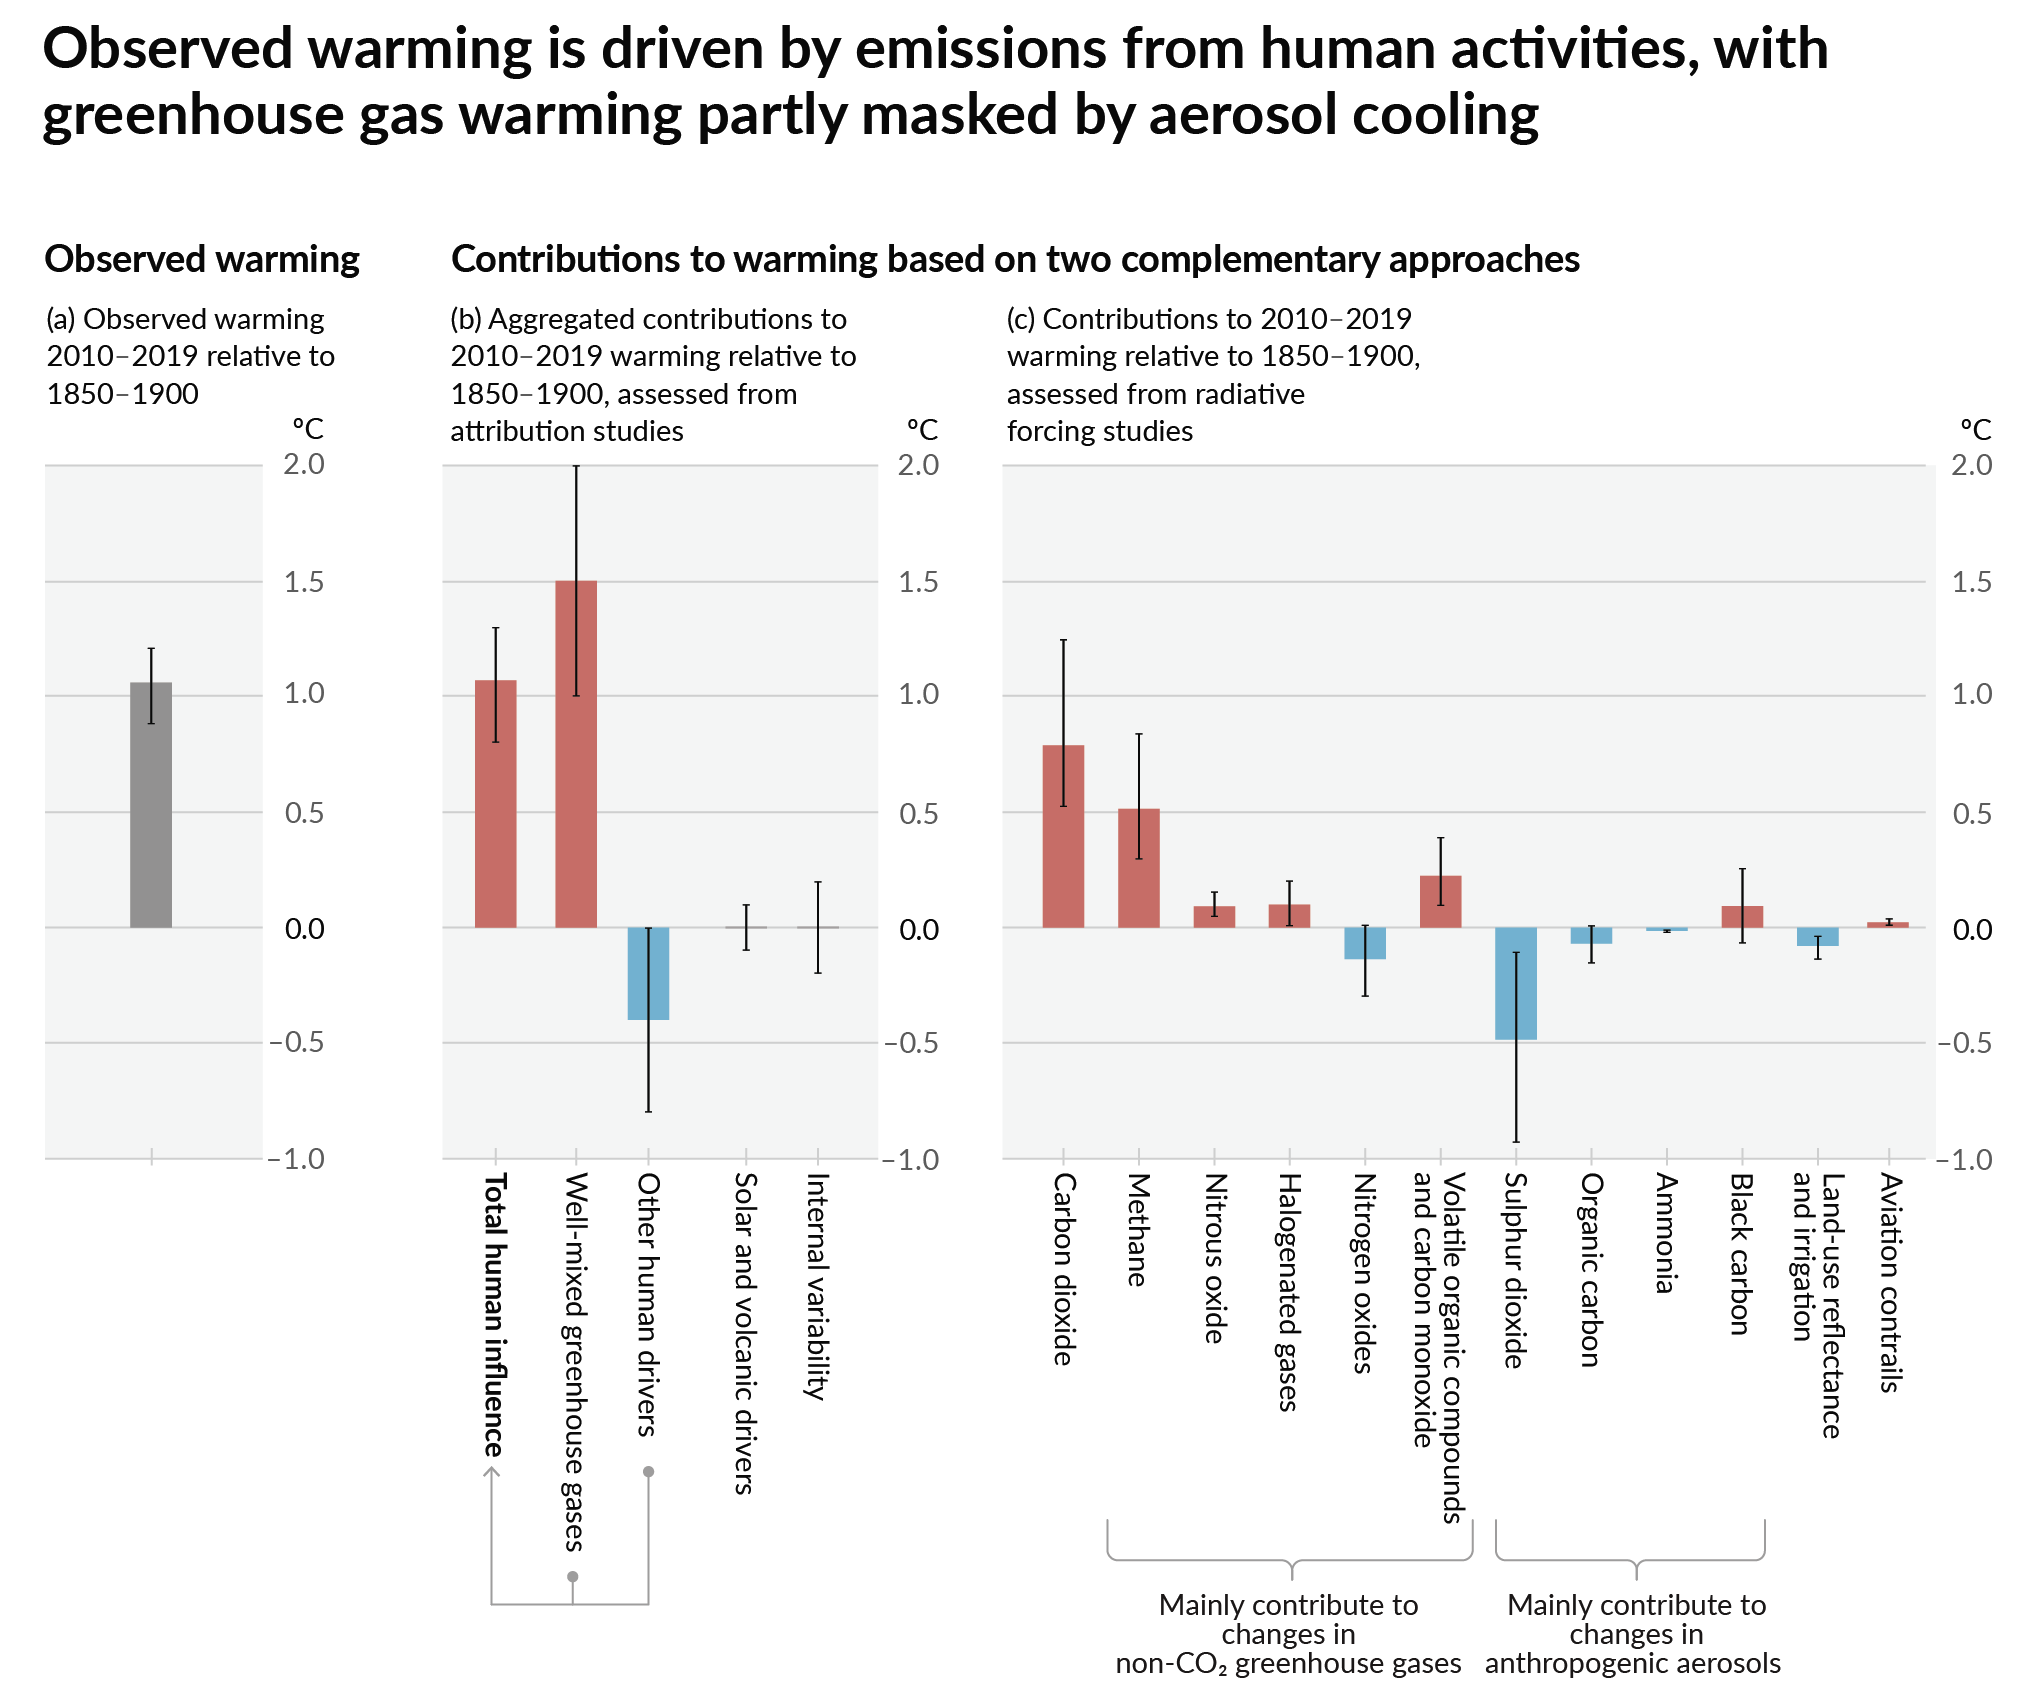
English: Contribution to observed climate change from 12 different drivers, as taken from the Summary for Policymakers of the sixth IPCC assessment report, adapted from figure SPM.2c.
|
| Dagsetning | |
| Uppruni | eigin skrá |
| Höfundarréttarhafi | Eric Fisk |
| Aðrar útgáfur |
File:Physical Drivers of climate change.svg has 2 embedded translations.
|


Leyfisupplýsingar:
- Þér er frjálst:
- að deila – að afrita, deila og yfirfæra verkið
- að blanda – að breyta verkinu
- Undir eftirfarandi skilmálum:
- tilvísun höfundarréttar – Þú verður að tilgreina viðurkenningu á höfundarréttindum, gefa upp tengil á notkunarleyfið og gefa til kynna ef breytingar hafa verið gerðar. Þú getur gert þetta á einhvern ásættanlegan máta, en ekki á nokkurn þann hátt sem bendi til þess að leyfisveitandinn styðji þig eða notkun þína á verkinu.
- Deila eins – Ef þú breytir, yfirfærir eða byggir á þessu efni, þá mátt þú eingöngu dreifa því verki með sama eða svipuðu leyfi og upprunalega verkið er með.
Breytingaskrá skjals
Smelltu á dagsetningu eða tímasetningu til að sjá hvernig hún leit þá út.
| Dagsetning/Tími | Smámynd | Víddir | Notandi | Athugasemd | |
|---|---|---|---|---|---|
| núverandi | 10. mars 2024 kl. 09:03 | | 960 × 893 (33 KB) | Hakimi97 | File uploaded using svgtranslate tool (https://svgtranslate.toolforge.org/). Added translation for ms. |
| 18. nóvember 2022 kl. 21:06 |  | 960 × 893 (30 KB) | Efbrazil | Renamed "Land-use changes" to "Irrigation and albedo", as land use changes contributing to CO2 emissions are not included in the bar (they are in the CO2 bar) | |
| 30. september 2022 kl. 06:36 |  | 960 × 893 (30 KB) | আজিজ | File uploaded using svgtranslate tool (https://svgtranslate.toolforge.org/). Added translation for bn. | |
| 10. september 2022 kl. 10:53 |  | 960 × 893 (24 KB) | Theklan | File uploaded using svgtranslate tool (https://svgtranslate.toolforge.org/). Added translation for eu. | |
| 19. apríl 2022 kl. 14:29 |  | 960 × 893 (21 KB) | Jiaminglimjm | File uploaded using svgtranslate tool (https://svgtranslate.toolforge.org/). Added translation for id. | |
| 10. janúar 2022 kl. 04:37 |  | 960 × 893 (17 KB) | TAKAHASHI Shuuji | File uploaded using svgtranslate tool (https://svgtranslate.toolforge.org/). Added translation for ja. | |
| 15. ágúst 2021 kl. 21:33 |  | 960 × 893 (13 KB) | Efbrazil | Source updated to AR6 / WG1 | |
| 13. maí 2020 kl. 15:56 |  | 960 × 807 (11 KB) | Nyq | Decapitalized common nouns | |
| 26. mars 2020 kl. 18:47 |  | 960 × 807 (11 KB) | Efbrazil | Tweaked positive color to match other chart color for consistency | |
| 3. mars 2020 kl. 21:55 |  | 960 × 807 (11 KB) | Efbrazil | Rebuilt the graphic from data. Changes: - SVG now has native text for translation and selection - Combined "other gases" into single bar - Label tweaks for easier reading (e.g. CH4 --> Methane) |
Skráartenglar
Eftirfarandi síða notar þessa skrá:
Altæk notkun skráar
Eftirfarandi wikar nota einnig þessa skrá:
- Notkun á ar.wikipedia.org
- Notkun á az.wikipedia.org
- Notkun á bcl.wikipedia.org
- Notkun á de.wikipedia.org
- Notkun á dty.wikipedia.org
- Notkun á el.wikipedia.org
- Notkun á en.wikipedia.org
- Causes of climate change
- Cloud feedback
- Sulfur dioxide
- Global dimming
- Radiative forcing
- Talk:Global dimming
- Climate change
- Carbon dioxide in Earth's atmosphere
- Talk:Greenhouse gas
- Greenhouse gas
- Atmospheric methane
- Portal:Climate change/Selected article
- Portal:Climate change/Selected article/16
- Gas venting
- Wikipedia:WikiProject Climate change/Figures
- Talk:Climate change/Archive 76
- Portal:Climate change
- Talk:Climate change/Archive 93
- User talk:InformationToKnowledge/sandbox
- Notkun á eu.wikipedia.org
- Notkun á fa.wikipedia.org
- Notkun á fr.wikipedia.org
- Notkun á gl.wikipedia.org
- Notkun á ha.wikipedia.org
- Notkun á hi.wikipedia.org
- Notkun á hi.wikibooks.org
- Notkun á id.wikipedia.org
- Notkun á ig.wikipedia.org
- Notkun á ko.wikipedia.org
- Notkun á ms.wikipedia.org
- Notkun á nl.wikipedia.org
- Notkun á pt.wikipedia.org
- Notkun á rw.wikipedia.org
- Notkun á so.wikipedia.org
- Notkun á sv.wikipedia.org
- Notkun á te.wikipedia.org
- Notkun á tr.wikipedia.org
- Notkun á zh.wikipedia.org
Skoða frekari altæka notkun þessarar skráar.