
Mynd:Norway Hubbert.svg

Upphafleg skrá (SVG-skrá, að nafni til 512 × 387 mynddílar, skráarstærð: 24 KB)
Lýsing
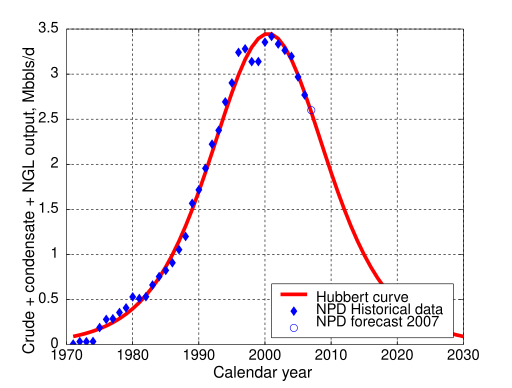
Illustration of Hubbert Theory with Norway's production.
This graphic is made under matlab and converted into SVG format using Juerg Schwizer's remarkable script [1] archive copy at the Wayback Machine.
The historical production figures are from the Norwegian petroleum directory website. It is the sum of "crude oil", "Natural gas liquids" and "Condensate" columns. The Norwegians publish data using metric units (production is in million cubic meters per years) so the data is here converted into oilfield units (million barrels per day) using 1 barrel = 0.159 cubic meters. Note the 2006 is a 11-month average because december figure is not yet available.
The red curve is a direct application of Hubbert's formula, with the following values :

The model fits the historical data well. Hubbert's model works well under a set of conditions (no major production disruption, no production quotas, sufficient available capital, no limitation due to infrastructure) and Norway fulfills all of them. NPD recently published a forecast of 2.6 million barrels per day for 2007, that is well in accordance with the model.
Future production seems likely to continue its decline. Interestingly, the Hubbert curve has a future production (integration from 2007 onwards) of 9 billions barrels, almost identical to NPD's proven reserve value. However, if a new oil exploration play is found (that may happen around the Wikipedia:Lofoten Islands or the Arctic), future production will be higher, because these new resources will give a new Hubbert cycle to be added to the main one.
Leyfisupplýsingar:

|
Gefið er leyfi til að afrita, dreifa og/eða breyta þessu skjali samkvæmt Frjálsa GNU Free Documentation License, útgáfu 1.2 eða nýrri, sem gefið er út af Frjálsu hugbúnaðarstofnuninni með engum breytingum þar á. Afrit af leyfinu er innifalið í kaflanum GNU Free Documentation License. |
| Þessi skrá er með Creative Commons Tilvísun-DeilaEins 3.0 Óstaðfært notkunarleyfi. | ||
| ||
| This licensing tag was added to this file as part of the GFDL licensing update. |
Breytingaskrá skjals
Smelltu á dagsetningu eða tímasetningu til að sjá hvernig hún leit þá út.
| Dagsetning/Tími | Smámynd | Víddir | Notandi | Athugasemd | |
|---|---|---|---|---|---|
| núverandi | 23. janúar 2007 kl. 19:22 | | 512 × 387 (24 KB) | Raminagrobis | Illustration of Hubbert Thérory with Norway's production. This graphic is made under matlab and converted into SVG format using Juerg Schwizer remarquable script [http://www.mathworks.com/matlabcentral/fileexchange/loadFile.do?objectId=7401&objectType= |
Skráartenglar
Eftirfarandi síða notar þessa skrá:
Altæk notkun skráar
Eftirfarandi wikar nota einnig þessa skrá:
- Notkun á ar.wikipedia.org
- Notkun á en.wikipedia.org