
Mynd:Sinh cosh tanh.svg

Stærð þessarar PNG forskoðunar á SVG skránni: 504 × 504 mynddílar. Aðrar upplausnir: 240 × 240 mynddílar | 480 × 480 mynddílar | 768 × 768 mynddílar | 1.024 × 1.024 mynddílar | 2.048 × 2.048 mynddílar.
Upphafleg skrá (SVG-skrá, að nafni til 504 × 504 mynddílar, skráarstærð: 17 KB)
Lýsing
| Lýsing |
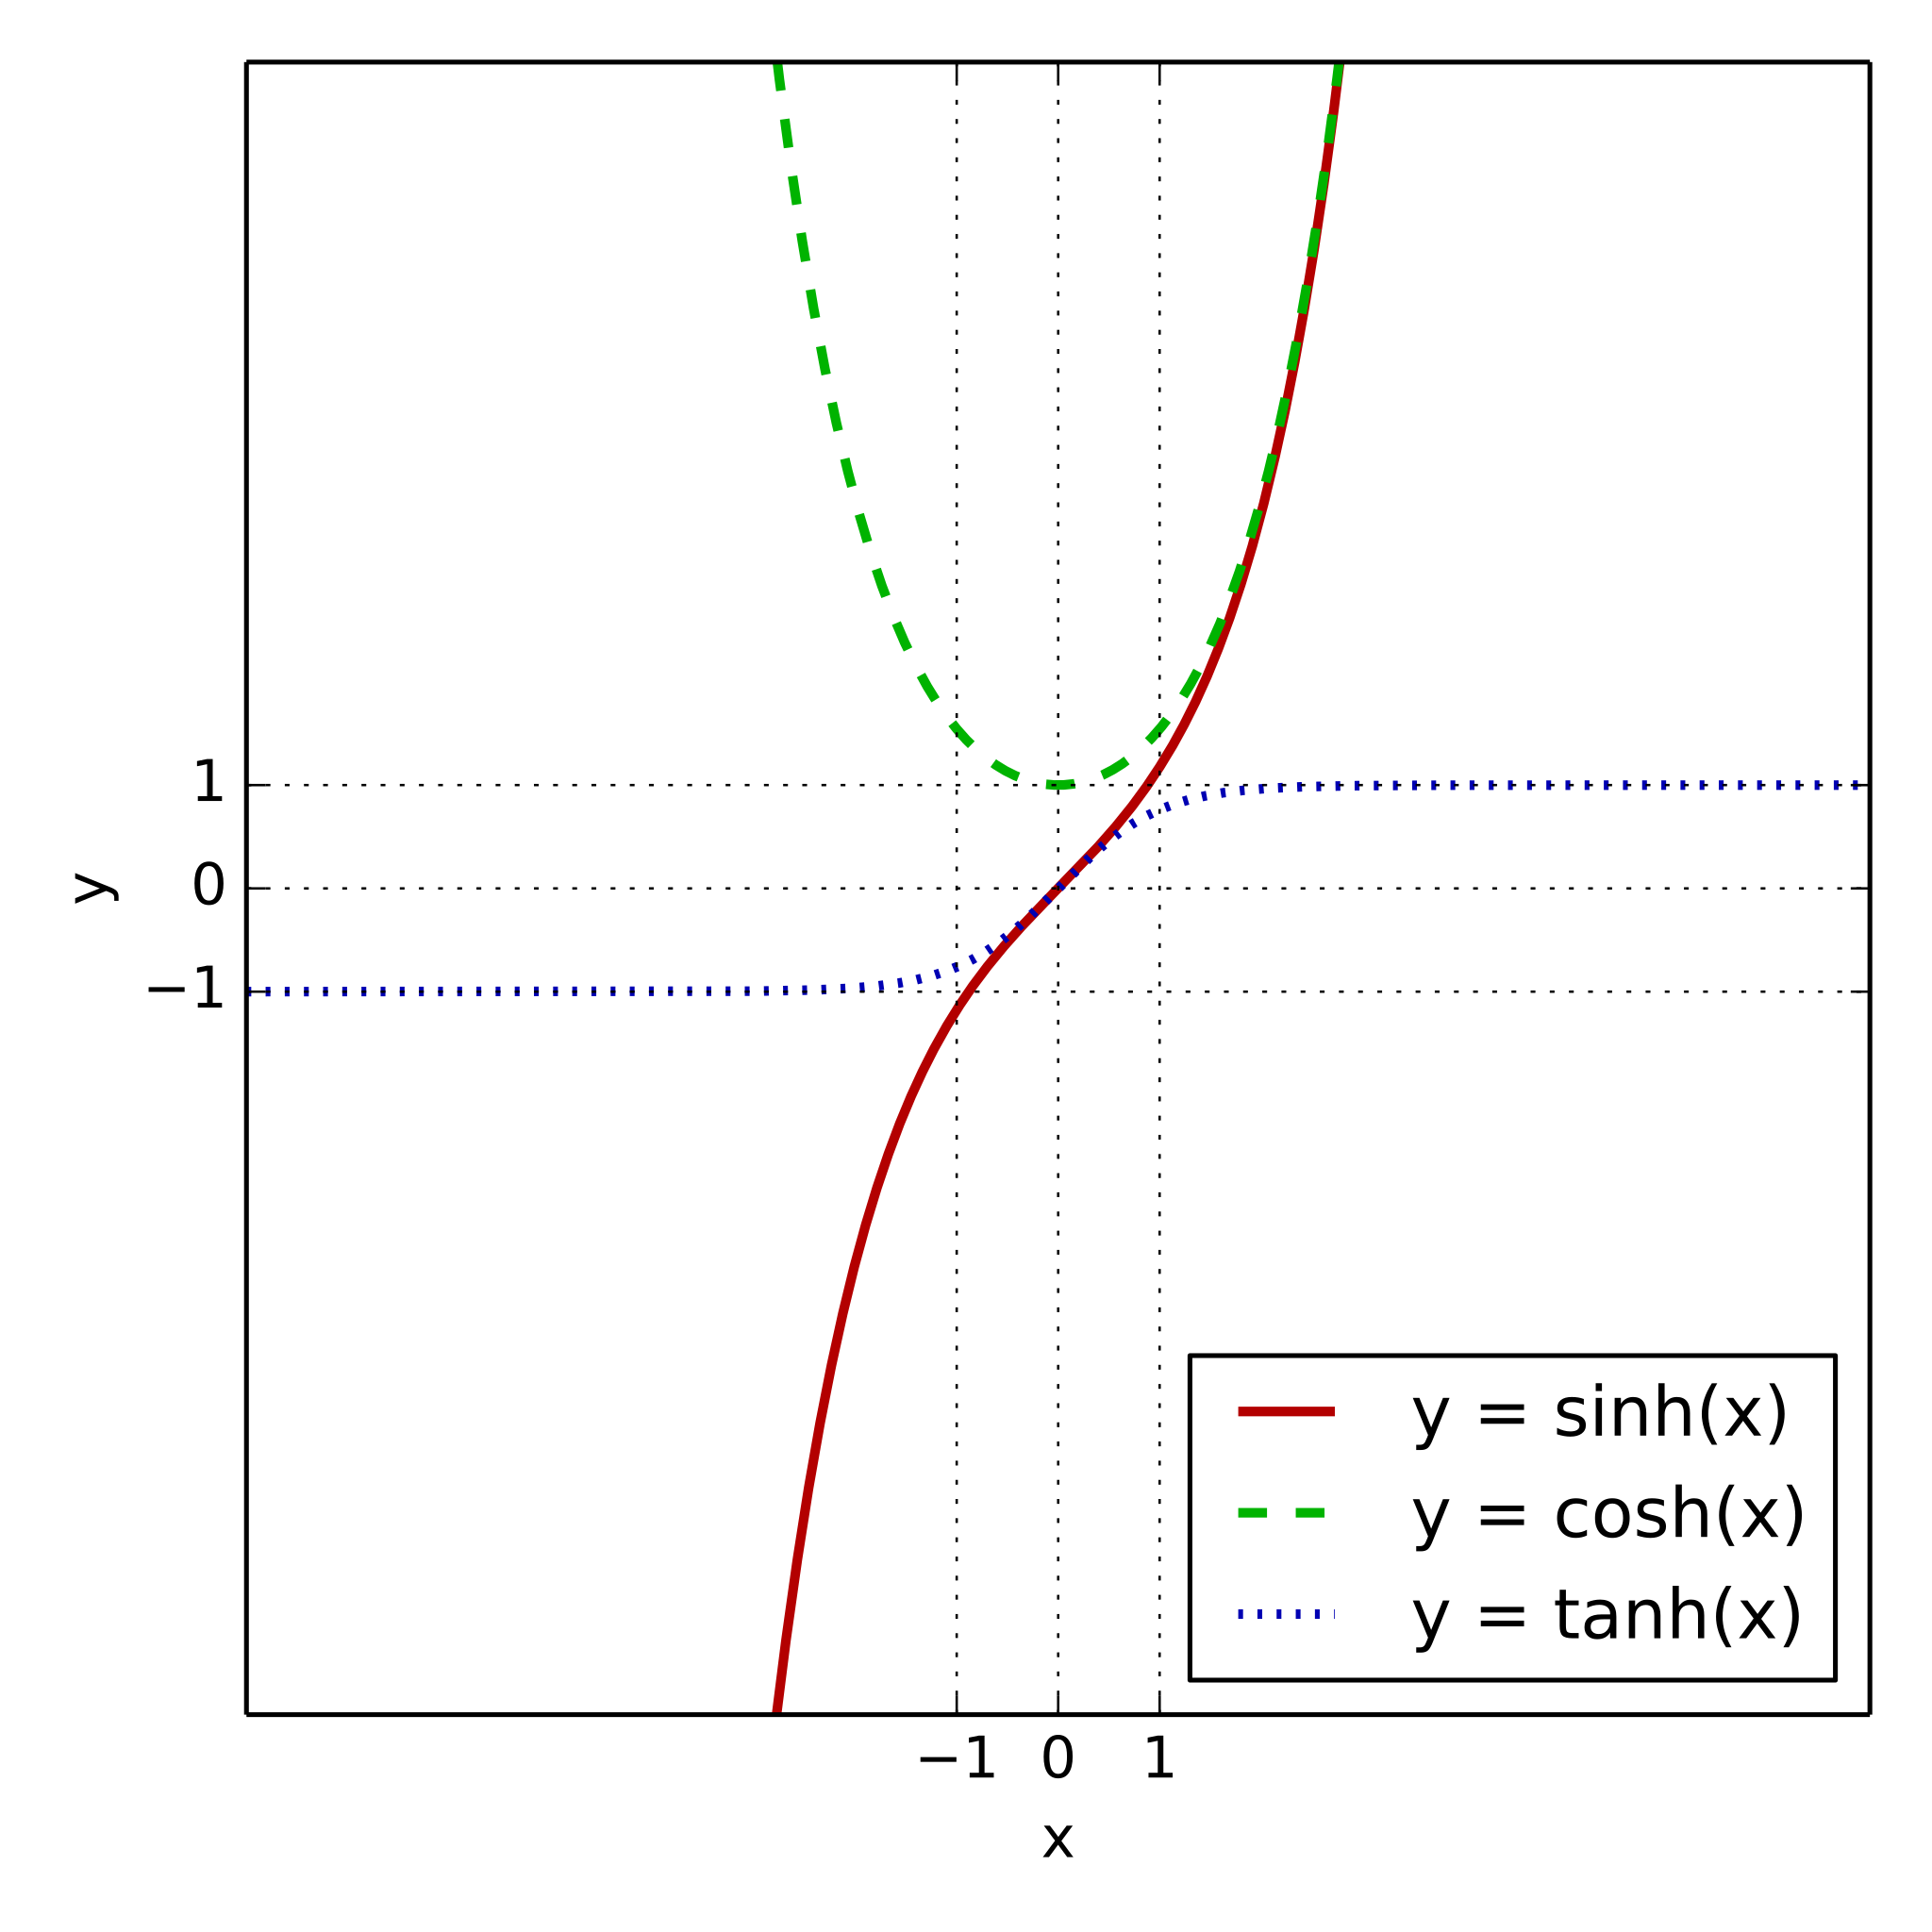
The hyperbolic sine (red), hyperbolic cosine (green) and hyperbolic tangent (blue) graphed on the same axes. Replaces en:Image:sinh cosh tanh.png
|
| Dagsetning | |
| Uppruni | eigin skrá |
| Höfundarréttarhafi | Fylwind at enska Wikipedia |
| SVG genesis | This plot was created with Matplotlib. |
| Source code | Python codeimport numpy as np
import matplotlib.pyplot as plt
lim = 8
size = 5.6
fig, ax = plt.subplots(figsize=(size, size))
xs = np.linspace(-lim, lim, 1000)
ax.plot(xs, np.sinh(xs), label="y = sinh(x)",
color="#b30000", linestyle="-", linewidth=2)
ax.plot(xs, np.cosh(xs), label="y = cosh(x)",
color="#00b300", linestyle="--", linewidth=2)
ax.plot(xs, np.tanh(xs), label="y = tanh(x)",
color="#0000b3", linestyle=":", linewidth=2)
ax.set_xlim(-lim, lim)
ax.set_ylim(-lim, lim)
ax.set_xticks([-1, 0, 1])
ax.set_yticks([-1, 0, 1])
ax.set_xlabel("x")
ax.set_ylabel("y")
ax.grid("on")
ax.legend(loc="lower right")
fig.tight_layout()
fig.savefig("sinh_cosh_tanh.svg", transparent=True)
|
Leyfisupplýsingar:
| I, the copyright holder of this work, release this work into the public domain. This applies worldwide. In some countries this may not be legally possible; if so: I grant anyone the right to use this work for any purpose, without any conditions, unless such conditions are required by law. |
Original upload log
The original description page was here. All following user names refer to en.wikipedia.
- 2006-03-14 10:22 Ktims 1600×1200×0 (8934 bytes) The hyperbolic sine (red), hyperbolic cosine (green) and hyperbolic tangent (blue) graphed on the same axes.
- 2006-03-14 10:21 Ktims 1600×1200×0 (8965 bytes) The hyperbolic sine (red), hyperbolic cosine (green) and hyperbolic tangent (blue) graphed on the same axes.
- 2006-03-14 10:15 Ktims 1600×1200×0 (8967 bytes) The hyperbolic sine (red), hyperbolic cosine (green) and hyperbolic tangent (blue) graphed on the same axes.
- 2006-03-14 10:15 Ktims 1600×1200×0 (8980 bytes) The hyperbolic sine (red), hyperbolic cosine (green) and hyperbolic tangent (blue) graphed on the same axes.
- 2006-03-14 10:14 Ktims 1600×1200×0 (8902 bytes) The hyperbolic sine (red), hyperbolic cosine (green) and hyperbolic tangent (blue) graphed on the same axes.
Breytingaskrá skjals
Smelltu á dagsetningu eða tímasetningu til að sjá hvernig hún leit þá út.
| Dagsetning/Tími | Smámynd | Víddir | Notandi | Athugasemd | |
|---|---|---|---|---|---|
| núverandi | 10. mars 2016 kl. 23:27 | | 504 × 504 (17 KB) | Fylwind | Make asymptotics more evident. |
| 6. febrúar 2007 kl. 00:39 |  | 1.600 × 1.200 (13 KB) | Alejo2083 | dashed lines | |
| 6. febrúar 2007 kl. 00:31 |  | 1.600 × 1.200 (9 KB) | Alejo2083 | {{Information |Description=The hyperbolic sine (red), hyperbolic cosine (green) and hyperbolic tangent (blue) graphed on the same axes. Replaces en::Image:sinh cosh tanh.png == Instructions == Generated with the following en:gnuplot source. XM |
Skráartenglar
Eftirfarandi síða notar þessa skrá:
Altæk notkun skráar
Eftirfarandi wikar nota einnig þessa skrá:
- Notkun á ar.wikipedia.org
- Notkun á az.wikipedia.org
- Notkun á bg.wikipedia.org
- Notkun á bs.wikipedia.org
- Notkun á ca.wikipedia.org
- Notkun á cs.wikipedia.org
- Notkun á cv.wikipedia.org
- Notkun á el.wikipedia.org
- Notkun á en.wikipedia.org
- Notkun á en.wikibooks.org
- Notkun á eo.wikipedia.org
- Notkun á et.wikipedia.org
- Notkun á eu.wikipedia.org
- Notkun á fa.wikipedia.org
- Notkun á ga.wikipedia.org
- Notkun á hi.wikipedia.org
- Notkun á hr.wikipedia.org
- Notkun á hu.wikipedia.org
- Notkun á id.wikipedia.org
- Notkun á km.wikipedia.org
- Notkun á ko.wikipedia.org
- Notkun á ko.wiktionary.org
- Notkun á mk.wikipedia.org
- Notkun á nn.wikipedia.org
- Notkun á pl.wikipedia.org
- Notkun á ro.wikipedia.org
- Notkun á simple.wikipedia.org
- Notkun á si.wikipedia.org
- Notkun á sq.wikipedia.org
- Notkun á sv.wikipedia.org
- Notkun á ta.wikipedia.org
- Notkun á tr.wikipedia.org
- Notkun á uk.wikipedia.org
- Notkun á uz.wikipedia.org
- Notkun á vi.wikipedia.org
- Notkun á wuu.wikipedia.org
- Notkun á zh-min-nan.wikipedia.org
- Notkun á zh-yue.wikipedia.org
- Notkun á zh.wikipedia.org